As a real estate professional guiding investors and families through the dynamic landscape of Greater Houston, I am frequently asked a foundational question: “Where should I place my capital right now?” In 2026, that question has evolved into a strategic choice between two powerhouse suburban submarkets, each representing a fundamentally different asset class: Katy’s multifamily sector and Cypress’s single-family market.
The macroeconomic climate of 2026—characterized by stabilized mortgage rates hovering near 6% and a widening affordability gap between renting and owning—has created distinct structural opportunities in these two regions. Whether you are looking to scale a commercial portfolio or anchor your wealth in high-equity residential real estate, understanding the hyper-local nuances of Katy and Cypress is essential. Let’s dive deep into the numbers, trends, and localized drivers defining our market today.
The 2026 Macro Environment: Why These Markets Matter Now
The Greater Houston metropolitan area continues to outpace national averages for population growth and corporate relocations. However, the cost of purchasing a median-priced single-family home has remained elevated, positioning the average monthly mortgage payment significantly higher than the average multifamily rent across the metro. According to recent national research insights from the Yardi Matrix US Multifamily Outlook, this affordability gap keeps rental occupancy rates exceptionally stable, even as new inventory enters the suburban fringes.
For investors, this means the suburban “outer ring” hubs of Houston are no longer just bedroom communities; they are highly competitive economic engines.
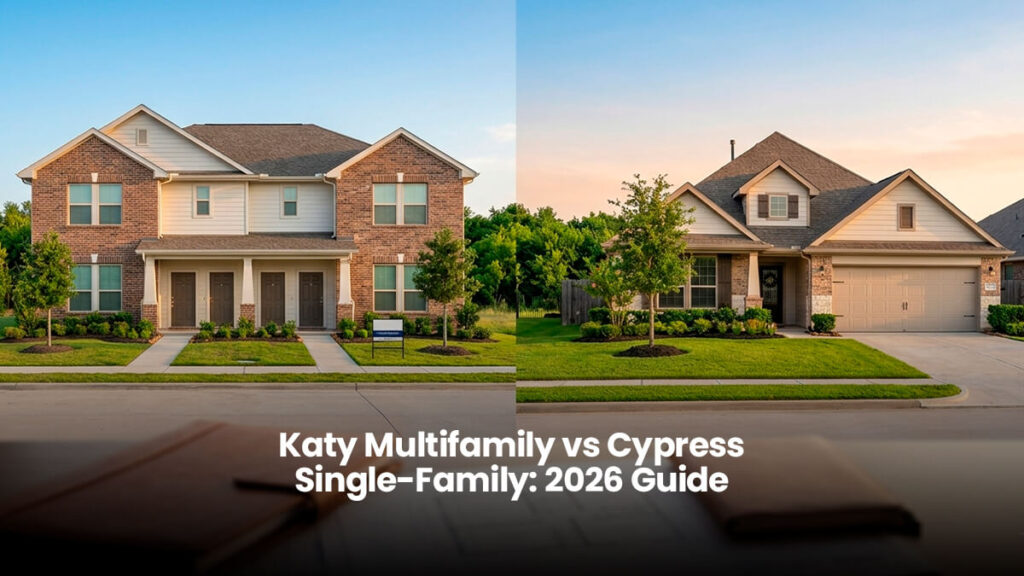
Katy Multifamily: Capitalizing on the Affordability Gap
Katy, Texas has long been synonymous with exponential population growth and top-tier infrastructure. In 2026, the local multifamily landscape is navigating a transition from a massive construction pipeline to a period of healthy absorption.
Supply and Rent Dynamics
While the urban core of Houston inside the Interstate 610 loop has seen new development drop significantly, suburban development along the Energy Corridor and the Grand Parkway (Highway 99) remains highly active. Data from the Northmarq Houston Multifamily Insights reveals that outer-ring submarkets like Katy are facing localized supply headwinds due to recent completions.
However, this wave of deliveries is being met with resilient demand. The strength of Class B and Class C assets in Katy remains undisputed, with vacancy rates holding remarkably low because working professionals prefer the safety and schools of Katy ISD over urban renting. Asking rents in Katy have shown a steady 1% to 2% growth in early 2026, proving that demand can absorb the supply.
The Investment Angle
For my investor clients looking at duplexes, fourplexes, or small apartment complexes in Katy, the play here is clear: consistent cash flow and a massive tenant pool.
The Tenant Profile: High-earning families or young professionals tied to the Energy Corridor who are waiting out current interest rates before buying.
Value-Add Opportunities: Acquiring early-2000s built multifamily units in Katy and executing light renovations yields excellent rent premiums without the risk of ground-up development.
Cypress Single-Family: A Strategic Pivot to Balance
Meanwhile, just a short drive north up the Grand Parkway, Cypress tells an entirely different real estate story. In 2026, the Cypress single-family residential market has officially settled into a more balanced, buyer-friendly rhythm, moving away from the frantic seller-market speeds of the past few years.
Pricing and Inventory Corrections
If you are looking to purchase a single-family home in Cypress, you have more leverage today than you have seen in a long time. According to current data from the Houston Association of REALTORS® (HAR), the median home price in Cypress sits at approximately $407,500, with the average closer to $470,000 when factoring in the luxury tiers of master-planned communities like Bridgeland and Towne Lake.
Market metrics pulled from Redfin Real Estate Data indicate that average days on market (DOM) have extended to roughly 40 to 57 days. More importantly, the sale-to-list ratio is hovering around 94.6%. This means buyers are successfully negotiating roughly 5% off asking prices, and nearly 45% of active listings have adjusted their pricing downward to meet the market.
School District Sovereignty and Appreciation
The crown jewel of Cypress remains the Cypress-Fairbanks ISD (Cy-Fair ISD). Even during minor market corrections, single-family homes in neighborhoods like Fairfield or Coles Crossing maintain exceptional long-term equity.
Sellers who price realistically are seeing their homes move in under 30 days. For move-up buyers or out-of-state investors looking for premier single-family rental (SFR) portfolios, Cypress provides a stable environment where you can negotiate closing cost concessions and rate buy-downs.
Side-by-Side Market Analysis
To help you visualize where these markets stand in 2026, let’s look at the core performance metrics side-by-side:
| Metric | Katy Multifamily Sector | Cypress Single-Family Sector |
| Primary Property Type | Duplexes, Fourplexes, Apartment Units | Detached Single-Family Homes |
| Median Entry Price | Varies by Unit Count ($350K+ for Duplexes) | $407,500 (Median) |
| Average Days on Market | 30 – 45 Days | 40 – 57 Days |
| Sale-to-List Ratio | 97% – 98% | 94.6% – 97.7% |
| Core Value Driver | Cash Flow, High Rentability, Energy Corridor proximity | School Districts (Cy-Fair ISD), Long-term Equity |
| Current Market Stance | Balanced / Landlord Favored on Class B/C | Balanced / Moderately Buyer-Friendly |
Strategic Verdict: Where Should You Invest?
Choosing between these two booming Houston submarkets depends entirely on your financial architecture:
Choose Katy Multifamily If:
Your primary objective is immediate yield and scalable rental income. By purchasing multifamily assets in Katy, you protect yourself against individual vacancy risks. If one tenant leaves a fourplex, you still have 75% of your gross income flowing in to cover the debt service. The continuous expansion of commercial centers along the Grand Parkway ensures a steady stream of renters looking for premium multi-unit layouts.
Choose Cypress Single-Family If:
Your objective is long-term wealth preservation, high appreciation potential, or a primary residence. Purchasing a single-family home in a premier Cypress neighborhood allows you to take advantage of motivated sellers in 2026. The ability to purchase up to 5% below list price, combined with the timeless demand for Cy-Fair ISD schools, means your downside risk is protected.
Frequently Asked Questions
Is Katy or Cypress better for real estate investing in 2026?
Both markets excel depending on your strategy. Katy is superior for multifamily, multi-unit cash-flow properties due to its proximity to the Energy Corridor and strong renter demographics. Cypress is the premier choice for single-family rental (SFR) portfolios and long-term equity appreciation driven by master-planned community development.
What is the median home price in Cypress, TX for 2026?
As of mid-2026, the median sale price for a single-family home in Cypress, TX is approximately $407,500, with average home values trending near $470,000 in top-tier subdivisions like Towne Lake and Bridgeland.
How are mortgage rates affecting Houston suburbs like Katy and Cypress?
With mortgage rates stabilizing around 6% in 2026, buyers in Cypress are seeing longer decision timelines and increased negotiating power, resulting in a 94.6% sale-to-list ratio. In Katy, these rates have expanded the rental market, as many families opt to rent multifamily units rather than buy.
Which school district drives more real estate value: Katy ISD or Cy-Fair ISD?
Both districts are elite tiers in Texas. Katy ISD heavily drives multifamily and single-family demand in the west, while Cy-Fair ISD anchors the single-family housing market stability throughout Cypress, protecting home values from steep market downturns.
Conclusion
If you are looking to navigate the nuances of the Houston real estate market, analyze a specific multi-family cap rate, or find an undervalued single-family home in Cypress, reach out to me directly. Let’s build your Texas real estate legacy together.
Aida Villalobos | Real Estate Broker
📞(346) 955-1049 / @realtor.aidavillalobos